PM Capital’s top gold pick
Growing disconnect between gold price and gold equities creates opportunity.
By Andrew Russell, PM Capital
PM Capital has had limited exposure to gold this decade. We were concerned by rising costs, poor operating performance, acquisitions in the sector, and ultimately, valuations across the major producers.
Factors driving a favourable outlook
Our view on gold equities changed late last year for two reasons. First, as the gold price made fresh record highs, gold equities significantly underperformed, with the major producers trading 40-60% below prior peaks.
Gold equities have lagged gains in gold bullion since 2011. The MSCI ACWI IMI Gold Index, a global barometer of 67 gold companies, has an annualised return of just 3.3% over 10 years to end-March 2024.
Gold equities (the blue line in Figure 1 below) have also significantly underperformed global equities (the yellow line) since 2011.
Figure 1: Cumulative Index Performance – Gold equities vs market – Price Returns (USD)
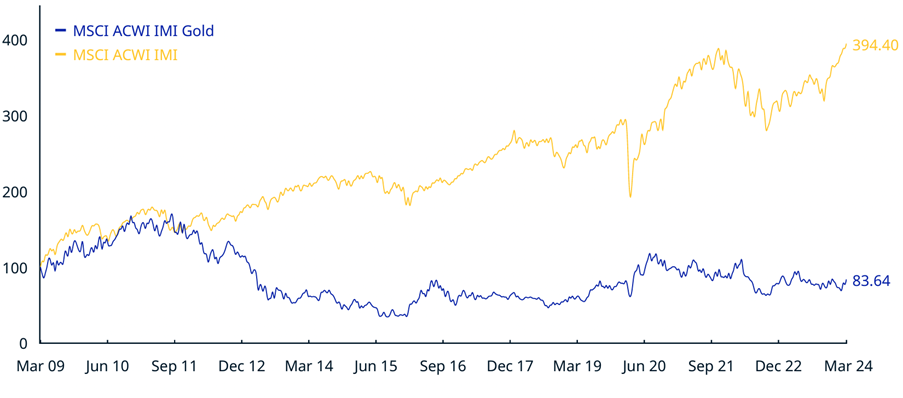
Source: MSCI (March 2009-March 2024).
Cost inflation largely explains gold equities’ lost decade. Margins have been squeezed amid rising labour, energy and project costs. Some producers are making the same margins at US$2,000 an ounce as they were at US$1,400, such has been the cost blowout.
The second reason for PM Capital’s positive view on gold equities is the supportive macro environment. Expected cuts in US interest rates later this year and a weaker US dollar could support the gold price, while the unsettled geopolitical climate could see continued central bank buying.
That said, we don’t expect gold to rally significantly from here. Rather, that a price above US$2,000 an ounce over the next few years could support a larger re-rating of select global gold producers.
These two factors have created an opportunity for long-term investors to gain exposure to gold producers - some of which have underperformed for decades – when the gold price is at a record high and underlying fundamentals look favourable.
Portfolio case study: Newmont Corporation
This is best illustrated through Newmont Corporation, the world’s largest gold producer. As Figure 2 below shows, Newmont has significantly underperformed the gold price for the past two decades, before PM Capital initiated a position in late 2023 as this underperformance widened. Newmont currently trades roughly at the same price it did 20 years ago, albeit with peaks and troughs.
Figure 2: Newmont versus gold price - significant underperformance
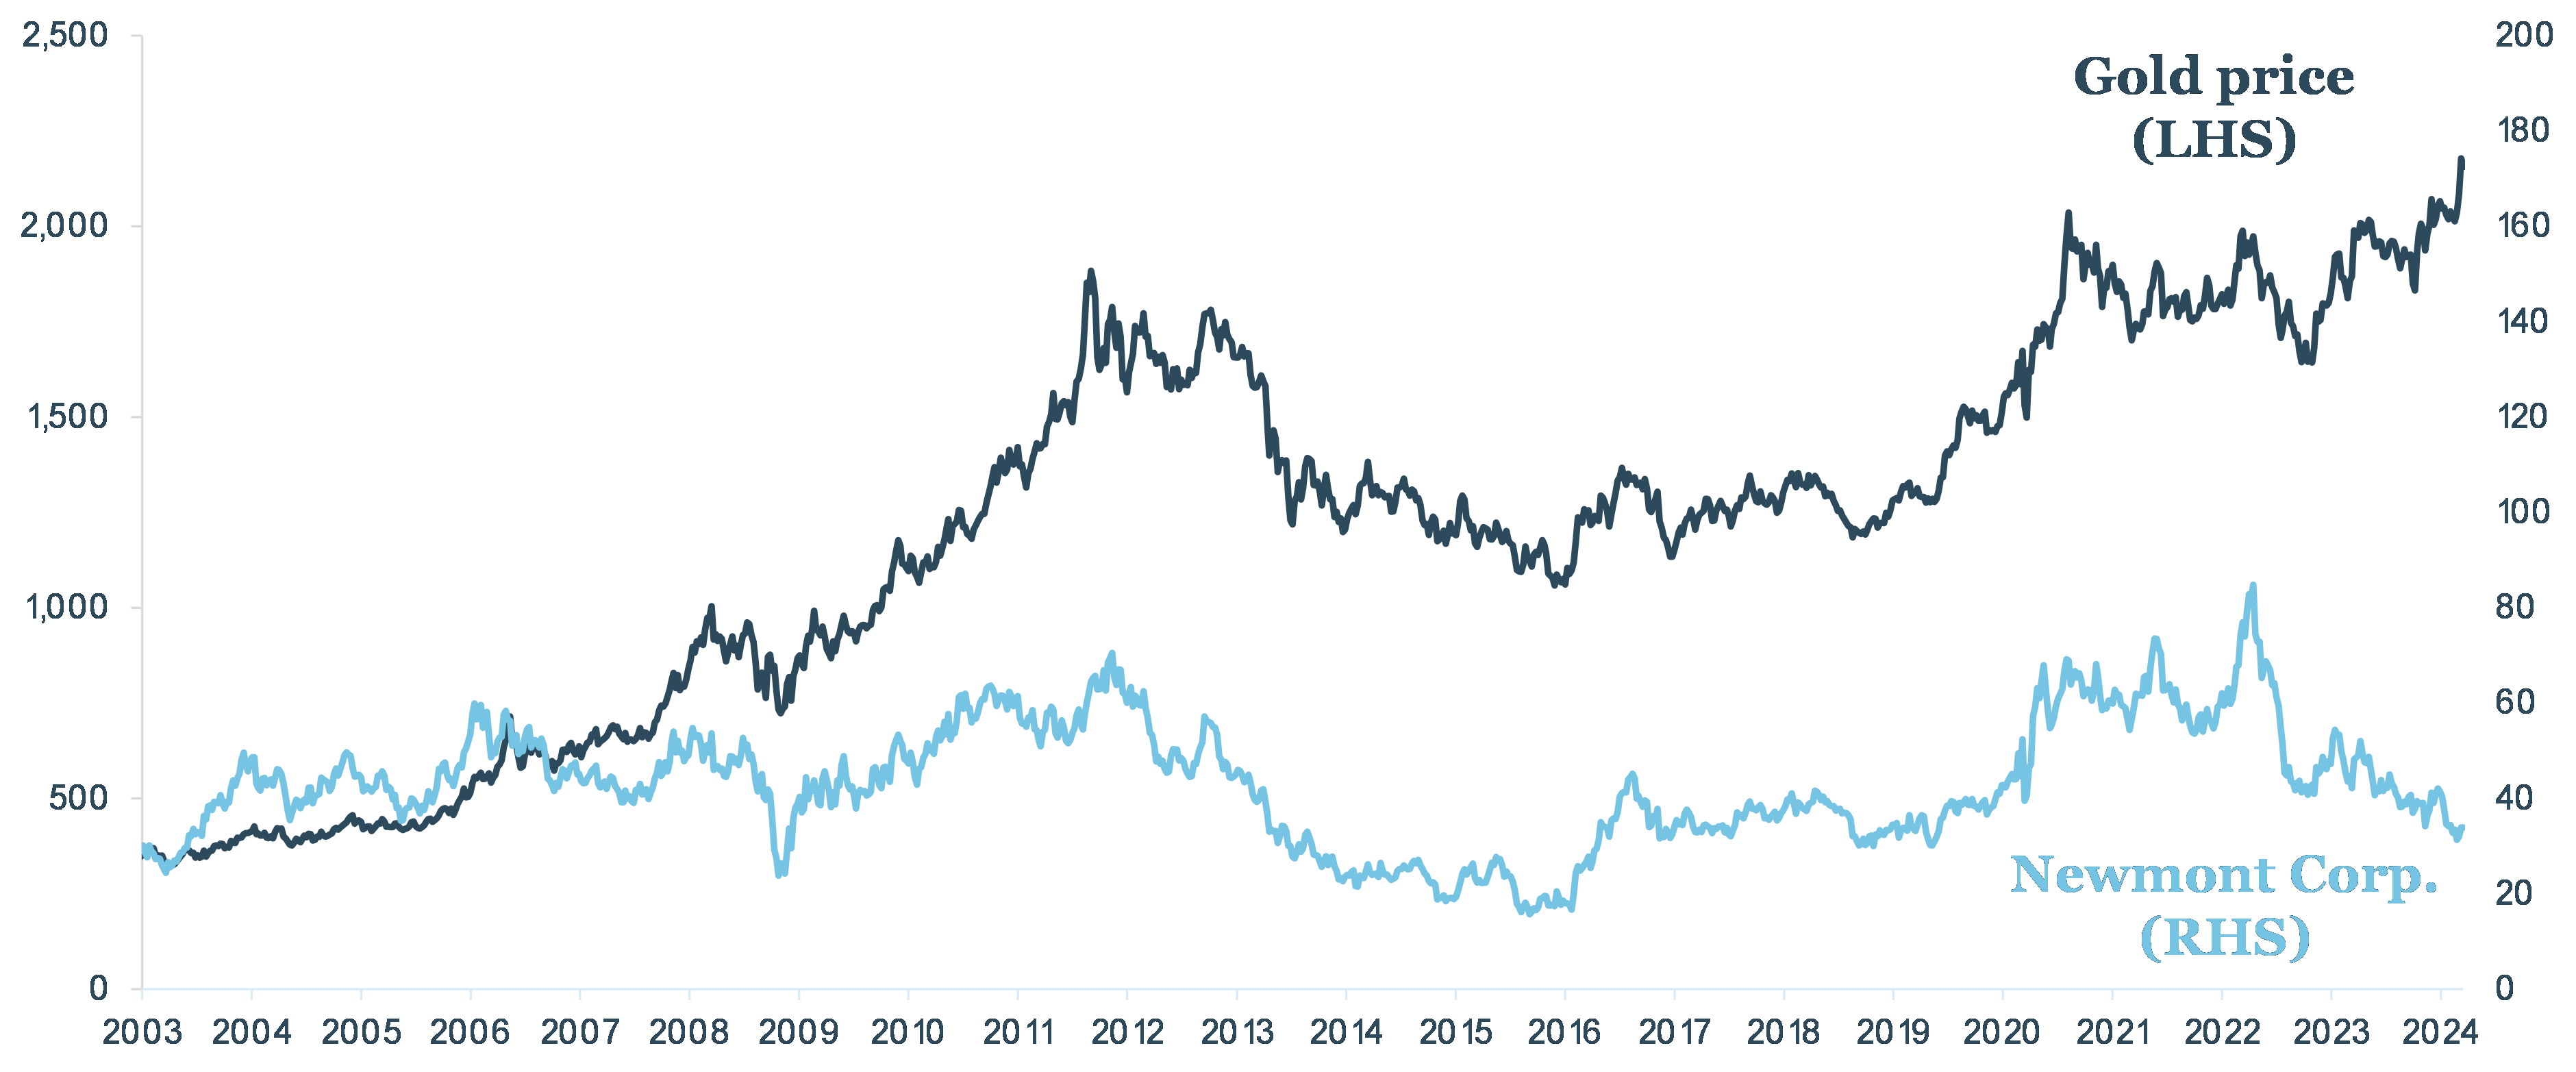
Source: FactSet, PM Capital
In the past 18 months, Newmont has attracted plenty of negative sentiment. The market worried about operational issues at some of its mines, resulting in unit costs increasing and weighing on the profit-based dividend calculation.
The market also worried about its acquisition strategy.
In 2019, Newmont acquired Canada’s Goldcorp and created a joint venture to combine Newmont and Barrick Gold Corporation’s Nevada gold assets in the US.
In May 2023, Newmont announced its acquisition of Newcrest Mining, Australia’s largest gold producer. The Newcrest takeover was poorly received by the market; Newmont shares have fallen 30% since announcing the deal despite gold increasing 15% over the same period. We, too, were initially critical of the Newcrest acquisition.
However, PM Capital believed the market over-reacted. For all its near-term challenges, Newmont offers the highest-quality exposure to the gold price. It is the world’s largest gold producer and owns more than half of global tier-1 gold mines, along with significant copper contribution.
Moreover, short-term problems hampering Newmont, such as a labour strike at its Mexican operations and poor performance at its Nevada joint-venture operations, should moderate. We expect Newmont’s operating performance to improve over the next couple of years, aiding its margins and earnings, and thereby increasing distributions back to investors.
A slowdown in Newmont’s acquisition strategy is another potential positive. Having completed the Newcrest deal, Newmont have outlined plans to extract synergies from the acquisition, sell off non-core assets, and then return incremental cash flow back to investors via dividends and buybacks. Indeed, with the gold price at current levels, we expect Newmont could buy back 10% of its shares per year while also paying a 3% annual dividend yield.
Combined with an improving operational performance, this expected return of capital to shareholders could be a catalyst for a larger re-rating of Newmont and bring its PE multiple in line with its historical average in the next few years. A higher dividend and the share buyback could also provide incentive for longer-term investors to wait for a recovery in Newmont to play out.
To conclude, a recovery in Newmont will take time. The US-based company has much ground to make up after underperforming the gold price and equity markets.
Also true is that last decade’s sector losers, such as gold, have a habit of being this decade’s winners. And that buying quality companies when irrationally oversold is key to delivering attractive long-term portfolio returns.
About the author
Andrew Russell is a Senior Analyst and Portfolio Manager within the PM Capital global equities team. PM Capital is a leading asset manager in Australian and global equities, and interest rate securities. More PM Capital Insights are available here.
This Insight is issued by PM Capital Limited ABN 69 083 644 731 AFSL 230222 as responsible entity for the PM Capital Global Companies Fund (ARSN 092 434 618), the "Fund". It contains summary information only to provide an insight into how we make our investment decisions. This information does not constitute advice or a recommendation, and is subject to change without notice. It does not take into account the objectives, financial situation or needs of any investor which should be considered before investing. Investors should consider the Target Market Determinations and the current Product Disclosure Statement (which are available from us), and obtain their own financial advice, prior to making an investment. The PDS explains how the Fund's Net Asset Value are calculated. Past performance is not a reliable guide to future performance and the capital and income of any investment may go down as well as up.